Introduction
If you’re diving into crypto trading, there’s one skill you can’t ignore: reading cryptocurrency charts. At first glance, charts may look like chaotic lines and bars but to a trained eye, they tell a powerful story about price action, trends, and potential entry or exit points.
This guide is for beginners who want to understand technical analysis (TA) and how to use charts to make informed trading decisions in the volatile world of cryptocurrency.
Why Learn to Read Cryptocurrency Charts?
Crypto markets are highly emotional and fast-moving. Charts give you a visual representation of price behavior and help you:
- Identify trends and reversals
- Time your entries and exits
- Avoid panic-based decisions
- Set stop-loss and take-profit zones
While fundamental analysis tells you what to buy, technical analysis tells you when to buy or sell.
Basic Types of Cryptocurrency Charts
1. Line Chart
- Plots a single closing price over time.
- Simple and clean but lacks detail.
2. Bar Chart
- Shows open, high, low, and close prices (OHLC).
- Offers more insight than a line chart.
3. Candlestick Chart
- Most popular among crypto traders.
- Displays:
- Body: Difference between opening and closing prices
- Wick: High and low for the time period
- Color: Green (up) or red (down)
Candlesticks help identify momentum, reversals, and patterns with visual clarity.
Understanding Time Frames
Charts can be viewed in different time frames:
- 1-minute to 15-minute: For scalping and short trades
- 1-hour to 4-hour: For swing trades
- 1-day to 1-week: For position trading and investment views
Choose a time frame based on your strategy. Long-term investors shouldn’t make decisions based on 5-minute charts.
Essential Cryptocurrency Chart Patterns to Know
1. Support and Resistance
- Support: Price level where buyers enter (floor)
- Resistance: Price level where sellers dominate (ceiling)
These levels can predict bounces or breakouts.
2. Trendlines
- Lines that connect price highs or lows.
- Help identify uptrends, downtrends, or sideways markets.
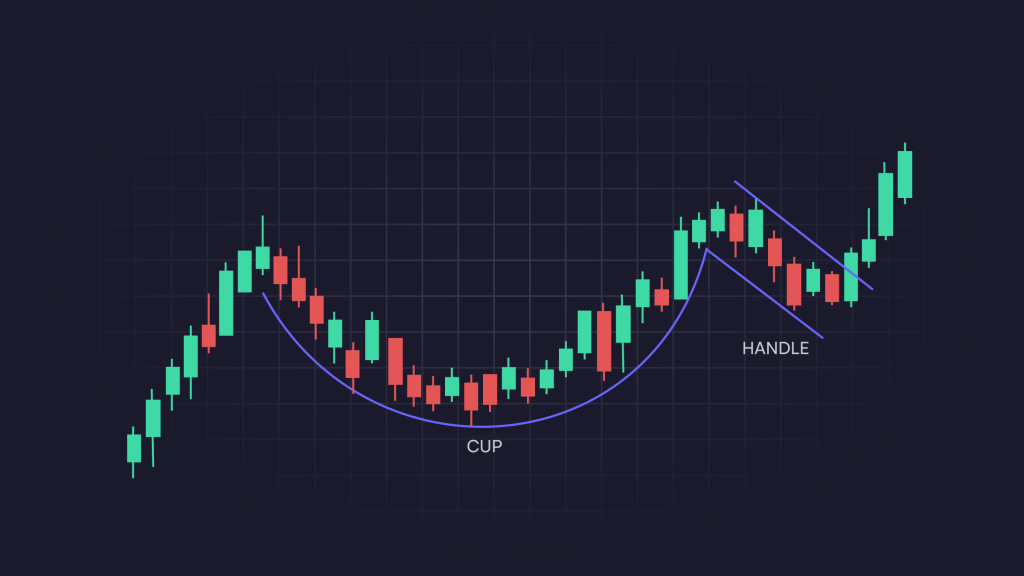
3. Chart Patterns
- Head and Shoulders: Reversal signal
- Double Top/Bottom: Reversal pattern
- Triangles: Continuation or breakout patterns
- Flags/Pennants: Indicate consolidation before continuation
Must-Know Technical Indicators
1. Moving Averages (MA)
- Smooth out price action to show trends.
- Simple MA (SMA) and Exponential MA (EMA) are common types.
2. Relative Strength Index (RSI)
- Measures if an asset is overbought (>70) or oversold (<30).
- Helps spot potential reversals.
3. MACD (Moving Average Convergence Divergence)
- Shows momentum and possible trend changes using two moving averages.
4. Volume
- Confirms the strength of a price move.
- High volume = strong move; low volume = weak or unreliable signal.
How to Read a Cryptocurrency Charts: Step-by-Step
- Choose the right time frame
- Identify the trend using trendlines or moving averages
- Mark support and resistance zones
- Look for candlestick or chart patterns
- Apply 1–2 technical indicators (e.g., RSI + MACD)
- Check the volume to validate signals
- Set stop-loss and take-profit points
Common Mistakes Beginners Make
- Overloading charts with too many indicators
- Ignoring the bigger trend by focusing on short time frames
- Making trades based only on one signal
- Forgetting to use risk management
Remember: Technical analysis is not magic, it’s probability. Use it to improve your odds, not guarantee success.
Tools for Crypto Charting
- TradingView (most popular, free and paid plans)
- CoinMarketCap/CoinGecko (basic charting for quick checks)
- Binance, Bybit, Kraken (integrated charts for trading)
Conclusion
Learning how to read crypto charts is an essential step toward becoming a more skilled and independent trader. While it may seem complex at first, practice and consistency will help you develop a sharper eye for price behavior. Learn about trading strategies to start trading.
At Crypto Relic, we believe that trading without reading charts is like sailing without a compass. With the right knowledge, you can navigate the crypto market more confidently and effectively.
1 thought on “How to Read Cryptocurrency Charts”